It’s 2021, and Cybersecurity has been a hot item on everybody’s list. Whether at home or in the corporate world, our technology is constantly evolving, and with the latest security patches and operating systems updated, our defenses have been getting better and better. That being said, hackers also endlessly test and experiment with new exploits and attack vectors to get a foothold on our systems.
So, what exactly can you do as an Incident Response Analyst when you are tasked to look at a computer that’s “running slow” and are responsible for finding out exactly what’s going on with it? There are many forensic tools out there that can be used for this job, such as FTK, Encase, Autopsy, etc.
However, in this article, I will highlight a tool that can be used to analyze live memory, and that tool is called Volatility. I will also demonstrate how this tool can be used in an actual Incident Response engagement with screenshots. I will also provide a link to a talk that I did at DerbyCon regarding this tool.
Volatility framework is an open-source collection of tools implemented in Python to analyze and extract forensic artifacts from live memory (RAM). RAM stands for random access memory, and it is more volatile than data on a disk. Hackers are not able to easily erase their tracks on RAM, as they do with the disk.
You can check out the GitHub at https://github.com/volatilityfoundation/volatility.
To get started using Volatility, you’re going to need to have the following:
- Vol.py – you can install this on a Linux/Ubuntu virtual machine or as a standalone executable on Windows. (instructions on how to install are found here: https://github.com/volatilityfoundation/volatility/wiki/Installation#getting-volatility)
- A memory sample – this is the memory dump you would capture from a host. You can use several free tools online for this, but I like to use WinPMEM. (https://github.com/Velocidex/WinPmem/releases)
And that is pretty much all you need to get started doing some forensics. Just the Volatility tool itself and a memory sample, plain and simple!
For this demonstration, I am going to use an infected memory sample that I found online on https://github.com/volatilityfoundation/volatility/wiki/Memory-Samples.
Scenario
You get a call from a user experiencing issues with their computer running extremely sluggish as if something is taking up the computer resources. They believe it has been infected, and you are tasked to find out what’s going on with it.
Running pslist
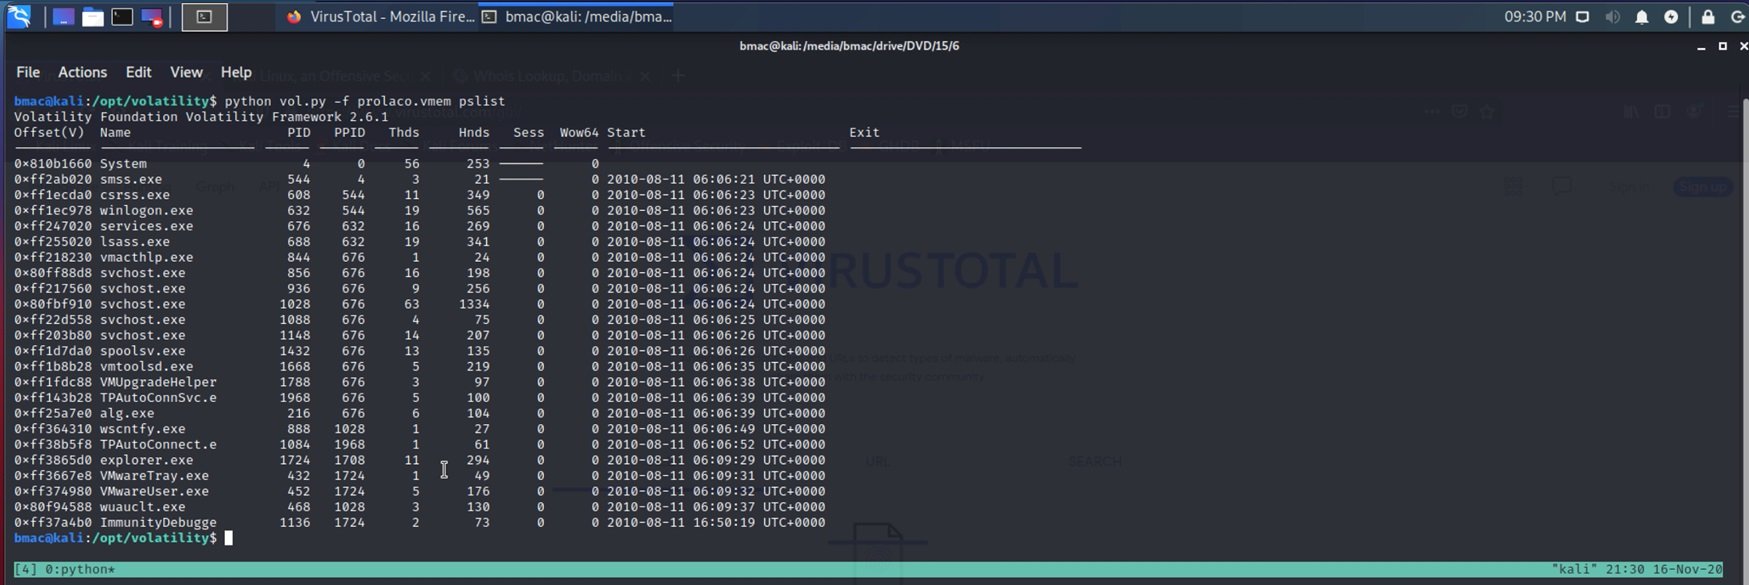
Pslist is a tool within Volatility that will show you an output of all the different processes running on the machine when the memory dump was captured. This is useful in finding out if any processes seem suspicious right off the bat.
Running psscan

In this command, I run a psscan, which is similar to a pslist. However, I output the results to a visual graph using xdot. The xdot output is great because you can visually see the parent/child processes from the psscan results.
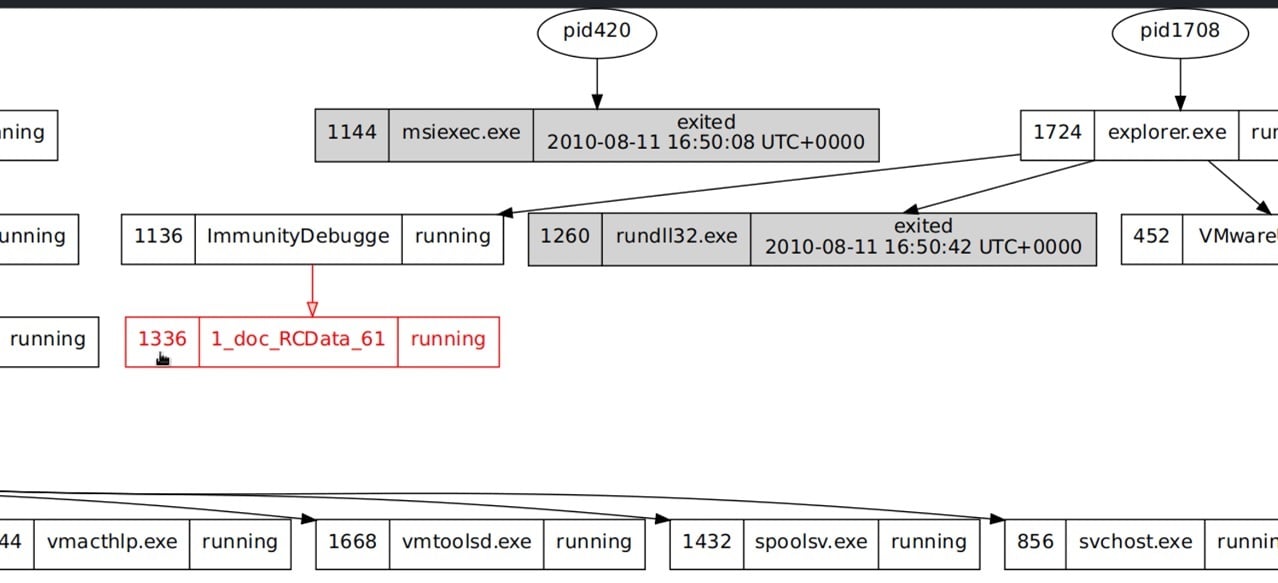
As you can see, the process “1_doc_RCData_61” was invoked by the “ImmunityDebugger.” This process did not initially show with the psslist, but the psscan is great for digging deeper and locating any hidden processes.
Running connscan
Now that I have a suspicious process I want to further examine, we can run a connscan. Connscan is a tool that is used to show any active TCP connections with a matching process ID.
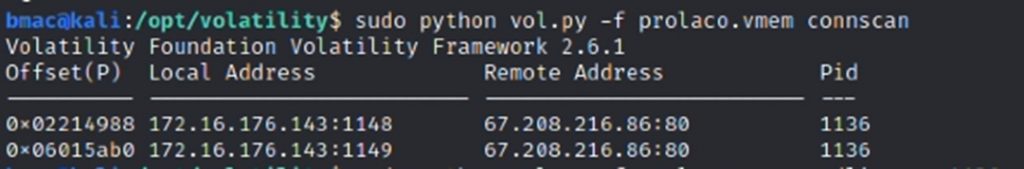
As you can see in the picture above, PID 1136 has created an active TCP connection from the host to remote address 67.208.216.86:80. A quick google search on that IP address shows that the IP belongs to a “TERENAP” domain. This is all valuable information you can collect and save for later.
Running cmdline
Another tool I like to use within volatility is called cmdline. Since I have a specific process I want to examine, I can use cmdline to show any cmdline executables running in the processes.
By running the cmdline tool on the process id “1136”, we were able to see that the process had the “1_doc_RCData_612.exe” running within the process.
Running procdump
Now that we know the process 1136 has an executable running, I can go ahead and procdump the process into an actual executable and run some tests.

At this point, I’ve turned the process into a full-fledged, live executable called “executable.1336.exe”.
I can now run this executable through VirusTotal and see what I get.

As you can see, VirusTotal has found 54 malicious hits on the executable file. The actual virus embedded inside the executable is called Prolaco. Prolaco is a popular internet worm that propagates and multiplies itself within a host, taking up system resources and causing the computer to run very slow.
As I said, I also did a talk on DerbyCom IE about Volatility and how it can be used for Incident Response.
Link to YouTube video for Volatility Demo: https://www.youtube.com/watch?t=3604&v=kz_SRcidetI (Starts at 1:00:04).
I hope this article has helped you learn more about computer forensics and memory forensics’ power using Volatility. Thanks for reading, and stay tuned for more content!
As a Managed Service Provider (MSP) and Managed Security Services Provider (MSSP), we manage your IT services, offer backup and disaster recovery, and provide network visibility and security. Our knowledgeable and customer-oriented staff engages to accelerate your network and simplify its security, visibility and automation. Questions? Contact Tec-Refresh, Inc.